🔎 Overview
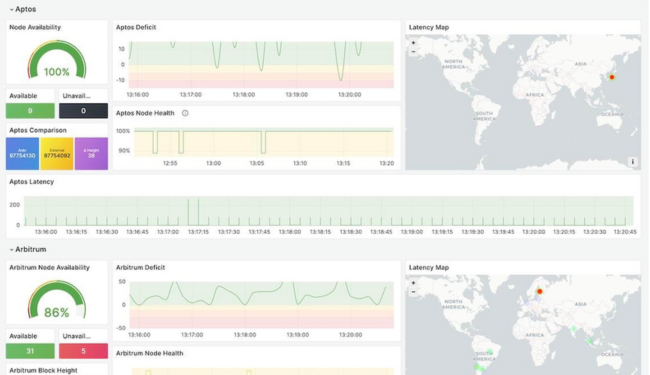
As a Technical Account Manager at Ankr, I built and deployed a Grafana-based dashboard that monitored 40+ blockchain RPC endpoints across multiple protocols, powering our public-facing Status Hub at status.ankr.com.
⚙️ Execution
The dashboard pulled and visualized live metrics (e.g., latency, availability, uptime, and throughput) using Prometheus exporters and API integrations. These metrics were critical for internal observability and external transparency.
✨ Impact
The live status page empowered Web3 developers and partners with real-time visibility into node performance. It also reduced inbound support tickets by giving users direct insight into incident resolution timelines.
✅ Acquired Skills
- Real-time network monitoring
- Grafana dashboard development
- Public incident communication
- API integration for blockchain endpoints
- DevOps visibility and alerting strategies